Measurement for improvement is about learning, not judgement.
In quality improvement, we measure to understand whether changes are helping in this setting, with these people, at this point in time. We are not trying to prove something once and for all. We are trying to learn what works and adapt as we go. Download a Data Collection Plan template.
What is it?
Measurement for improvement sits alongside research and performance measurement, but it has a different purpose.
- Research asks “Does this work in general?”
- Performance measurement asks “How are we doing?”
- Measurement for improvement asks “How do we make this work here?”
- To help understand the terms you may come across when using data and measurement for improvement, this guide is really helpful: A-Z of Measurement.
- Watch Mike Davidge from the NHS Institute for Innovation and Improvement talk about the seven steps to measurement for improvement https://youtu.be/Za1o77jAnbw?feature=shared
When planning measurement for an improvement project, keep the following principles in mind:
- Measure only what will help you learn
- Use data to support decision-making, not to prove success
- Keep data collection simple and proportionate
- Involve the team in agreeing measures and definitions
- Look for patterns over time, not one-off results
The goal is not to generate the perfect dataset, but to generate just enough data to guide action.
Types of measures
Three types of measures are commonly used in improvement work:
- Outcome measures assess the impact on patients and reflect the results of improvement efforts. For example, infection rates can be an outcome measure.
- Process measures focus on the functioning of systems and processes that contribute to the desired outcomes. An example would be compliance with hand-washing protocols.
- Balancing measures consider the potential positive or negative effects of changes on other aspects of the system. They help identify unintended consequences and maintain overall balance.
Understanding data over time
One of the most important ideas in measurement for improvement is looking at data over time. One-off audits or before-and-after comparisons can be misleading. Improvement is about understanding patterns, variation and sustainability. This is where run charts and SPC charts are particularly useful.
A run chart is a simple line graph that plots a measure over time, usually with a median line.
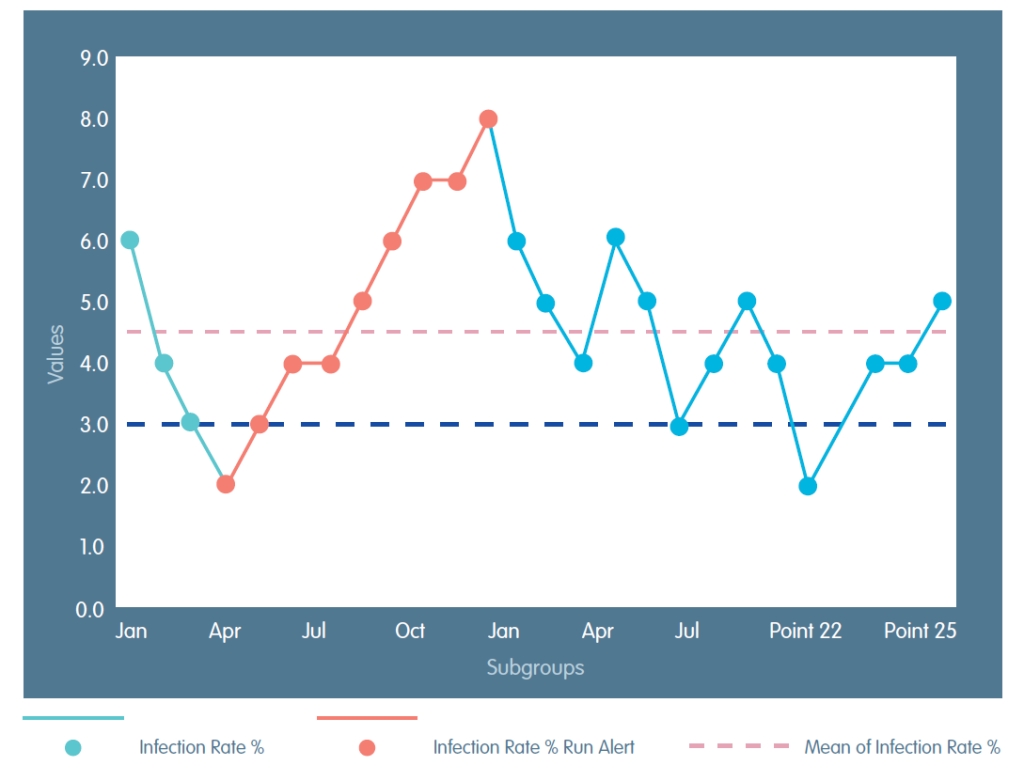
To show that things have improved you need to show the things that have changed, and that the change is not a one off. You must consider whether the change has been sustained. Statistical process control (SPC) charts build on the same principles as run charts but include control limits that help you understand variation within a process. SPC does not require advanced statistical skills. Read more about SPC charts in the Cambridge Elements of Improving Quality and Safety in Healthcare Statistical Process Control.
You do not need to choose one or the other forever. A common and sensible approach is to start with run charts to support early learning. Move to SPC charts when you want greater confidence about variation and sustainability of a change.
Both tools support the same underlying principle: using data over time to inform improvement.
Using qualitative data
Not all improvement data is numerical. Qualitative information such as patient stories, staff feedback, and observations of practice can add important context to quantitative measures, especially when trying to understand why a change is or is not working. Combining different types of information often leads to richer learning.
Data for improvement excel masterclass – When working with data, improving your Excel skills can help you process, clean and present your data. Watch our masterclass on using Excel with data for improvement and download the video transcript.
What is evaluation and why is evaluation important for quality improvement?
Check out our resources on evidence and evaluation for more information.